China develops an XGBoost model that predicts the synthesis difficulties of fragments for designer chromosomes

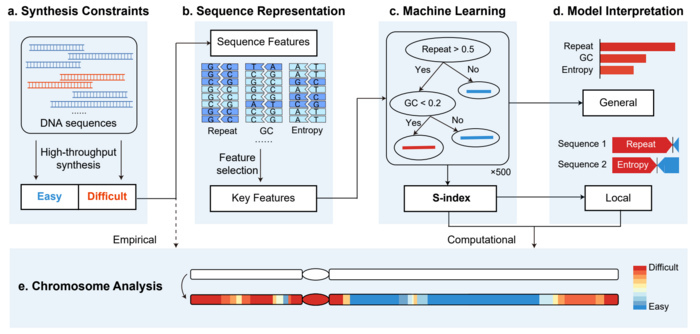
Artificially synthesizing genomes has broad prospects in medical research and industrial strains. From the synthesis of the artificial life JCVI-syn1.0 by Craig Venter's team in 2010, to the rewriting and synthesis of the prokaryotic E. coli genome, and the Sc2.0 project's artificial synthesis of the yeast genome, researchers are constantly advancing in the depth and breadth of genome design and synthesis. However, there are still difficulties in synthesizing specific gene segments, ultimately leading to the inability to complete artificial chromosomes, which limits the application and promotion of artificial genome synthesis technology. To address this issue, the team of Professor Yingjin Yuan from Tianjin University in China has developed an interpretable machine learning framework (Figure 1) that can predict and quantify the difficulty of chromosome synthesis, guiding optimizing chromosome design and synthesis processes.
The research team designed an efficient feature selection method by analyzing data from many known chromosome fragments and identified six key sequence features that cover energy and structural information during DNA chemical synthesis and assembly. Based on these results, the team developed an eXtreme Gradient Boosting (XGBoost) model that can effectively predict the synthesis difficulties of chromosome fragments. The model achieved an AUC (area under the receiver operating characteristic curves) of 0.895 in cross-validation and an AUC of 0.885 on an independent test set in collaboration with a DNA synthesis company, demonstrating a high accuracy and predictive ability.
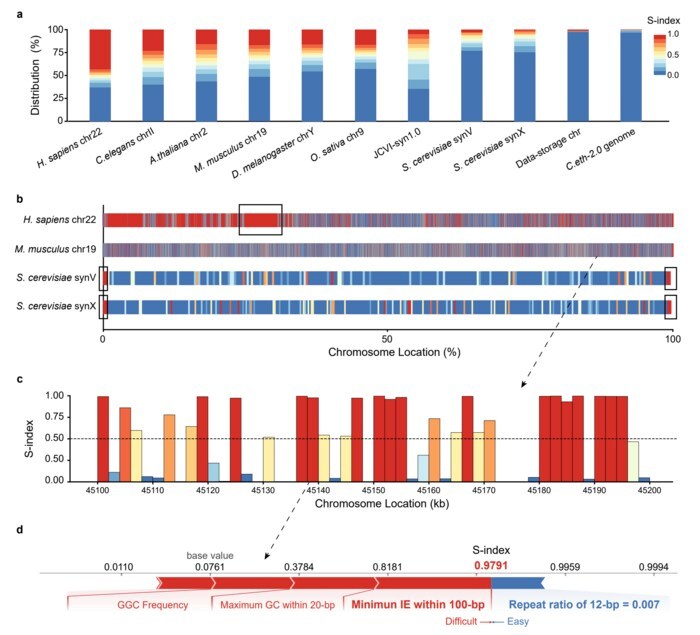
The research team proposed a Synthesis difficulty Index (S-index) based on the SHAP algorithm to evaluate and interpret the synthesis difficulties of chromosomes. The study found that there were significant differences in the synthesis difficulties of different chromosomes, and the S-index could quantitatively explain the causes of synthesis difficulties for some gene fragments (Figure 2), providing a basis for chromosome sequence design and synthesis and improving the efficiency and success rate of designer chromosome synthesis. This achievement provides a practical tool for researchers in chromosome engineering and genome rewriting and is expected to provide more comprehensive guidance and support for chromosome design and synthesis. 

 How to resolve AdBlock issue?