China develops Earth system models with clouds, ocean submesoscale eddies

It has been a dream for Earth scientists to have a numerical model that can better represent compound multiple-scale processes in the real-world Earth system. Apart from requiring a deep understanding of the physics of geo-fluid motions, developing such a model demands interdisciplinary advancement in the Earth sciences and high-performance supercomputing as well as software engineering. "The successful development of Earth system models with clouds and ocean submesoscale eddies permitted is a milestone in the advancement of understanding the Earth system," said Dr. Lixin Wu. 
Based on the newly-developed “Sunway” heterogeneous architecture supercomputer which has high-performance computing capability, Shaoqing Zhang, Lixin Wu, and Yang Gao, a group of scientists at the Ocean University of China, together with Shiming Xu, Haohuan Fu, and Zhao Liu, a group of professors and engineers at Tsinghua University and National Wuxi Supercomputing Center, organize a large cross-field group of scientists and engineers to take the challenges and develop new high-resolution Earth system models.
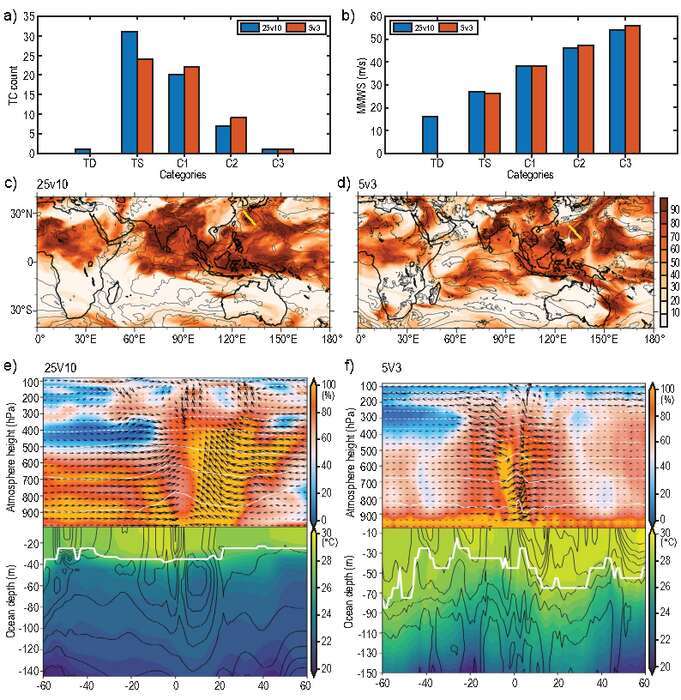
After resolving plenty of physical and engineering issues, the large group successfully developed a series of high-resolution coupled Earth system models consisting of 12, 9, and 5 km resolution atmosphere-land models and 15, 10, 5, and 3 km resolution ocean-ice models. “These models can meet the needs of multiscale interaction studies with different computational costs," said Dr. Shaoqing Zhang.
These high-resolution models can simulate cloud cells and ocean submesoscale vortex filaments to some degree. Therefore, they can bring a new understanding of weather-climate mechanisms from the perspective of cross-scale interactions. "The most exciting results from these new high-resolution models are that the major weather-climate extremes in the atmosphere and ocean are captured, stressing the importance of permitted clouds and ocean submesoscale eddies in modeling tropical cyclones and eddy-mean flow interactions,” said Drs. Shiming Xu and Yang Gao.
“The new heterogeneous many-core architecture high-performance supercomputer brings new opportunities for climate modeling once the optimization of heterogeneous architecture computing is efficiently implemented. The low work consumption of heterogeneous architecture computing complies with the ‘green’ future of the world,” said Drs. Haohuan Fu and Zhao Liu.
The new high-resolution Earth system models lay the foundation for future efforts to sustain the advancement of the Earth sciences through modeling more complex biogeochemical processes and carbon cycling. “These models pave for further model development to resolve finer scales with even higher resolution and more realistic physics. For example, based on these results, development of a non-hydrostatic, cloud and ocean submesoscale resolving Earth system model has been undergoing,” said Drs. Shaoqing Zhang and Yang Gao.

 How to resolve AdBlock issue?