MOVIES
Cincinnati builds model that predicts how racial makeup of neighborhoods will change
The machine learning algorithm proves 86% accurate in one test
A map created by researchers at the University of Cincinnati can predict with surprising accuracy how the racial makeup of neighborhoods will change. 
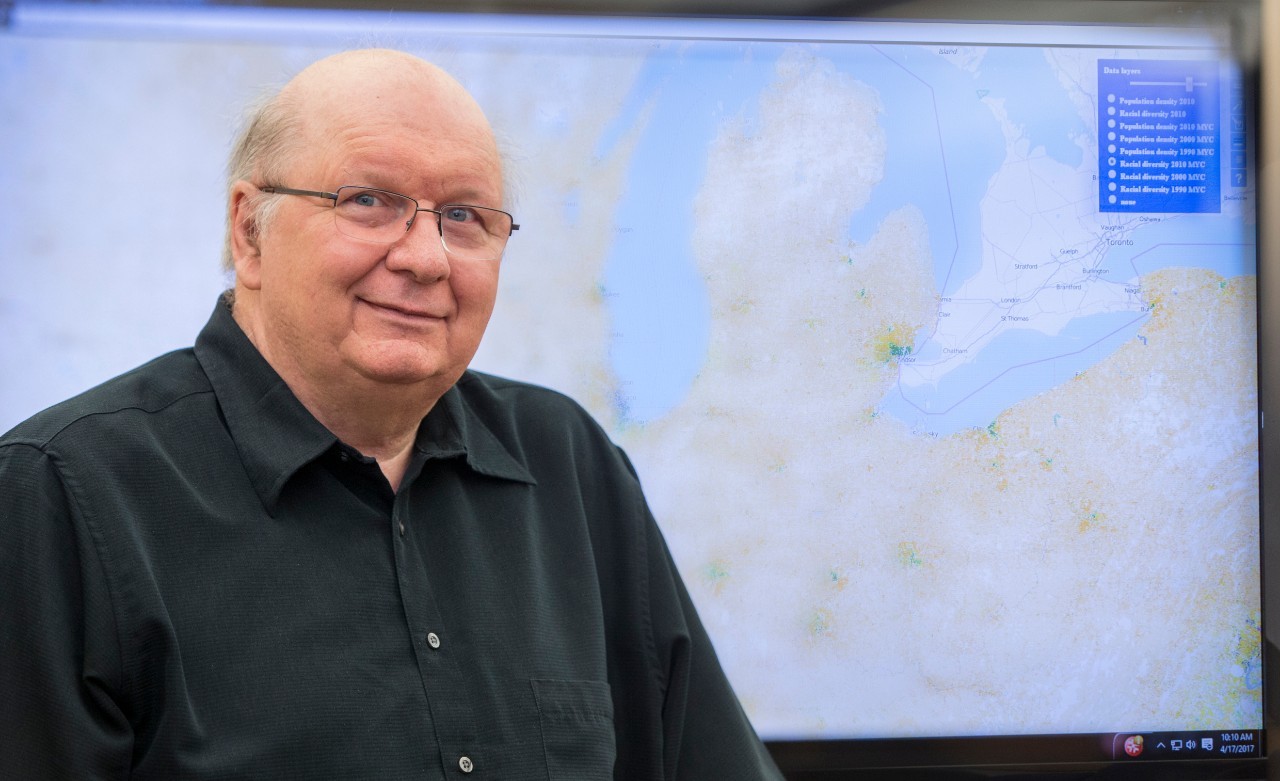
UC College of Arts and Sciences geography professor Tomasz Stepinski created a machine-learning algorithm to predict in fine detail how neighborhoods will become more or less segregated in the next 10 years.
Stepinski, who works in UC’s Space Research Institute for Discovery and Exploration, analyzed data collected by the U.S. Census Bureau every decade. They mapped the data by racial composition in the high resolution of 300-meter squares called cells.
The algorithm had to be “trained” to interpret the data from two census years spaced 10 years apart. The algorithm also examined individual cells in relation to those around them.
“The name ‘machine learning’ suggests there’s something magical about it, but it’s just more powerful statistics,” Stepinski said.
Stepinski validated his algorithm by comparing its predictions to actual data from the 2010 and 2020 censuses and found it was up to 86% accurate.
“Our hypothesis that you can predict the class of a cell in 10 years based on the previous two classes and surrounding classes was correct,” he said. “It’s not perfect, but you can see it’s pretty good.”
The study was published in the journal Machine Learning with Applications.
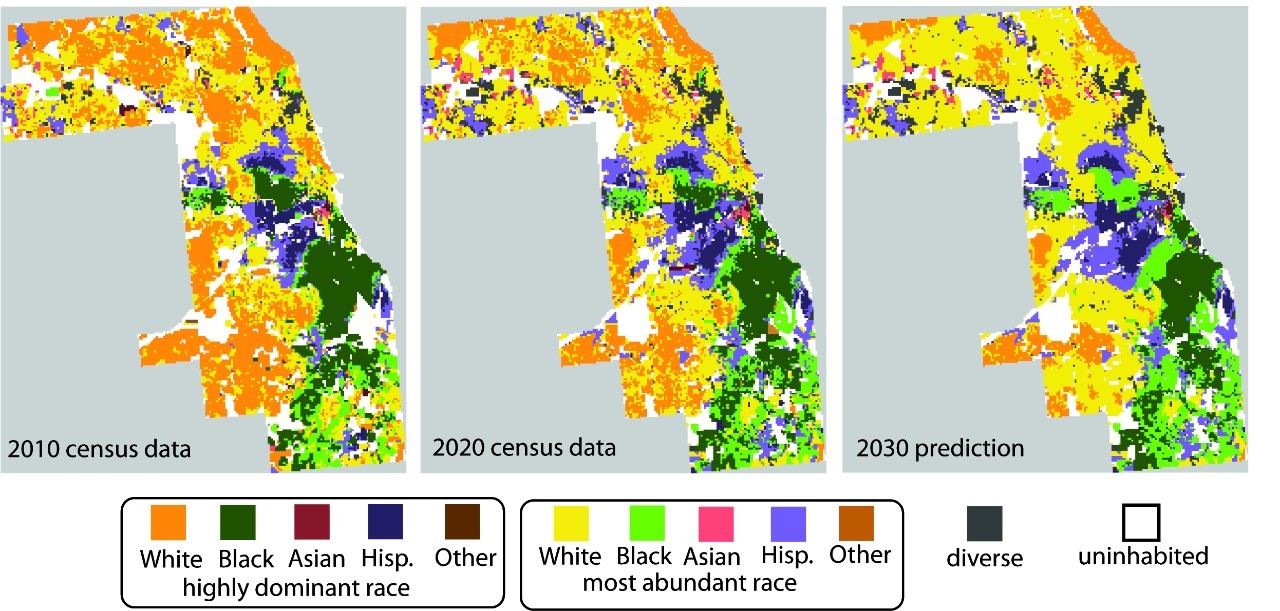
Stepinski and co-author Anna Dmowska, an assistant professor in the Department of Geoinformation at Adam Mickiewicz University in Poland, applied their algorithm to Chicago’s Cook County, Illinois, considered one of the most racially segregated places in America.
UC’s map showed that many neighborhoods dominated by white and Black populations will become less segregated by 2030 with less noticeable changes in neighborhoods dominated by Hispanic and Asian American populations.
Stepinski said researchers in Chicago have conducted pioneering sociological research on race, ethnicity, and gentrification using Cook County as their model. The sprawling, heavily populated county also provides a good model to study the algorithm because it still has many segregated neighborhoods despite trending toward greater racial and ethnic diversity over the last 50 years, he said.
Stepinski also applied the algorithm to Houston, Texas, and Los Angeles and San Francisco in California with similar success.
“The ability to predict demographic changes is essential from a scientific point of view and for policymakers, city development, etc.,” co-author Dmowska said.
“As shown in the paper, the predictive maps are pretty accurate and show how the area might look in the next 10 years,” she said.
Stepinski said the predictive maps could be used to help schools or governments plan for more services such as Spanish-speaking classrooms or interpreters. It also could help sociologists understand the driving forces behind the changing demographics of neighborhoods.
“My interest is not sociological. My specialty is computation,” Stepinski said. “I leave the why to someone else. But I can imagine what’s happening.” 
Stepinski said younger generations are often likely to remain in nearby neighborhoods if they remain in an area at all. And if one particular racial population declines in an area, others typically fill the void.
“It’s diffusion,” Stepinski said. “So in Cook County, you have a Hispanic population that is growing faster than the white population. They’re going to move close by. They’re not going to move far from home.”
