

A significant stride in the realm of communication technology has been marked by the pioneering efforts of a team of scientists who have harnessed the potential of 6G communications through the development of a cutting-edge polarisation multiplexer. Unveiling the transformative power of terahertz communications, this breakthrough not only promises data transmission rates far beyond current systems but also lays the foundation for ultra-fast wireless communication and data transfer.
As the demand for higher bandwidth and enhanced data capacity surges, the emergence of terahertz frequencies as the next frontier in wireless technology heralds a new era of possibilities. One of the central challenges in this domain has been the efficient management and utilization of the available spectrum, a challenge that has been tackled head-on by the team's innovative approach.
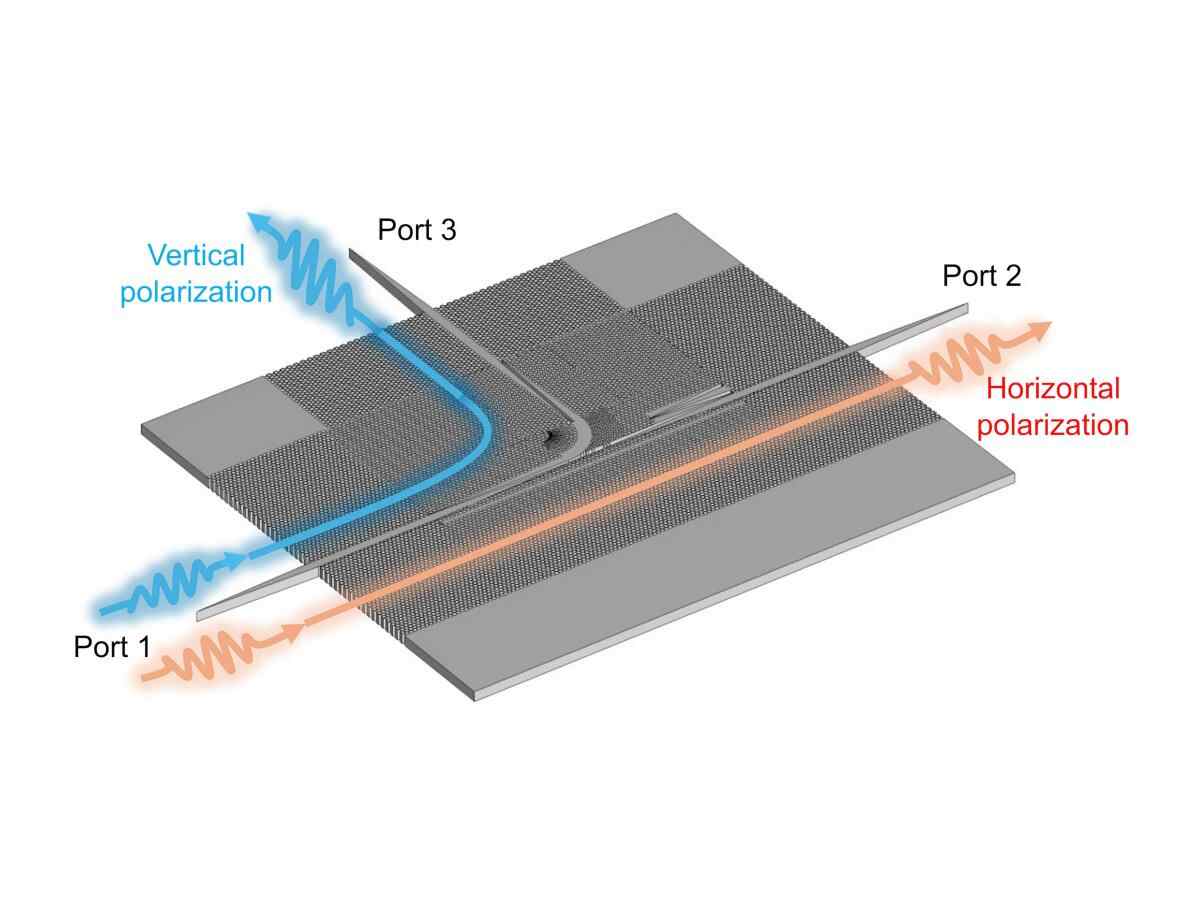
Led by the esteemed Professor Withawat Withayachumnankul from the University of Adelaide's School of Electrical and Mechanical Engineering, the team has successfully developed the first ultra-wideband integrated terahertz polarisation (de)multiplexer. This groundbreaking device, implemented on a substrateless silicon base, has been rigorously tested in the sub-terahertz J-band (220-330 GHz), showcasing its potential for revolutionizing 6G communications and beyond.
Professor Withayachumnankul elucidates the significance of the team's innovation, highlighting how the proposed polarisation multiplexer facilitates the simultaneous transmission of multiple data streams over the same frequency band, effectively doubling the data capacity. This unparalleled relative bandwidth, a record-setting feat in integrated multiplexers, underscores the transformative potential of this advancement in reshaping the landscape of communications technology.
Moreover, the team's device not only enhances communication efficiency by reducing data loss but also enables cost-effective large-scale production through standard fabrication processes. This technological leap not only bolsters the efficiency of terahertz communication systems but also paves the way for more robust and reliable high-speed wireless networks, positioning it as a pivotal enabler for realizing the full potential of terahertz communications.
Dr. Gao affirms the critical role of the polarisation multiplexer in accelerating progress towards high-speed wireless networks, emphasizing how this innovation can drive advancements in diverse fields such as high-definition video streaming, augmented reality, and next-generation mobile networks like 6G. The implications of this advancement extend far beyond mere communication, offering a glimpse into a future where seamless connectivity and rapid data transfer are the norm across various industries and applications.
The team's significant contributions have not only advanced the practicality of photonics-enabled terahertz technologies but also catalyzed a surge of interest and research activity in the field. Looking ahead, the team envisions significant progress in high-speed communications over the next three to five years, paving the way for commercial prototypes and early-stage products.
Professor Withayachumnankul's foresight reflects a vision of widespread adoption and integration of terahertz technologies within the decade, a transformational shift that is poised to revolutionize telecommunications, imaging, radar, the Internet of things, and beyond. The seamless integration of the latest polarisation multiplexer with the team's earlier beamforming devices on the same platform sets the stage for achieving advanced communication functions that herald a new era of connectivity and technological advancement.
In a landscape where innovation is the cornerstone of progress, the team's breakthrough underscores the immense potential of collaboration, research, and technological ingenuity in propelling the future of communications. With a commitment to excellence and a vision for transformative change, the strides made in terahertz communication technology serve as a testament to human endeavor in unraveling the mysteries of the digital age.
