

 How to resolve AdBlock issue?
 ")
Researchers have devised a new concept of superconducting microwave low-noise amplifiers for use in radio wave detectors for radio astronomy observations and successfully demonstrated a high-performance cooled amplifier with power consumption three orders of magnitude lower than that of conventional cooled semiconductor amplifiers. This result is expected to contribute to the realization of large-scale multi-element radio cameras and error-tolerant quantum supercomputers, both of which require a large number of low-noise microwave amplifiers.
The device they used is called an SIS mixer. The SIS mixer is named after its structure, a skinny film of insulator material sandwiched between two layers of superconductors (S-I-S). In a radio telescope, cosmic radio waves collected by an antenna are fed into an SIS mixer, and the output signal is amplified by low-noise semiconductor amplifiers. An SIS mixer operates in a very low-temperature environment, as low as 4 Kelvin (-269 degrees Celsius), and the amplifiers are also used at that temperature.
To improve the performance of radio telescopes, researchers are developing a large-format radio camera equipped with 2D arrays of SIS mixers and amplifiers. However, power consumption is a limiting factor. The typical power consumption of a semiconductor amplifier is about 10 mW, and by assembling 100 sets of detectors, the total power consumption reaches the maximum cooling capacity of a 4 Kelvin refrigerator.
The research team led by Takafumi Kojima, an associate professor at the National Astronomical Observatory of Japan (NAOJ), has come up with a simple but innovative idea to realize a superconductor amplifier by connecting two SIS mixers. The team exploits the basic functions of the SIS mixer: frequency conversion and signal amplification. “The most important point is that the power consumption of an SIS mixer is, in principle, as low as microwatts,” says Kojima. “This is three orders of magnitude less than that of a cooled semiconductor amplifier.”
After obtaining successful preliminary results in 2018, the team advanced both the theoretical studies of the system and the physical implementation of its various components. In the end, the research team optimized the system and realized an “SIS amplifier” with 5 - 8 dB (three to six times) gain below the frequency of 5 GHz and a typical noise temperature of 10 K, which is comparable to the current cooled semiconductor amplifiers such as HEMT and HBT, but with much lower power consumption.
“By changing the configuration of the components, we can further improve the gain and low-noise performance of an SIS amplifier,” explains Kojima. “The idea of connecting two SIS mixers has broader applications for making various electronics that have functions other than amplification.”
Interestingly, this low-noise, low-power-consumption amplifier is also highly anticipated for large-scale error-tolerant quantum computers. Currently available quantum computers are small-scale with less than 100 qubits, but larger-scale, error-tolerant general-purpose quantum computers will require more than 1 million qubits. To handle a large number of qubits, a large number of amplifiers must also be installed, and dramatic reductions in amplifier power consumption are needed.
NAOJ has experience in the development of superconducting receivers for a number of radio telescopes, including NAOJ’s Nobeyama 45-meter Radio Telescope, which started operation in 1982. NAOJ is also currently working to upgrade the superconducting receivers to improve the performance of the Atacama Large Millimeter/submillimeter Array (ALMA), which is operated in the Republic of Chile in cooperation with East Asia, Europe, and North America. Of the 10 types of receivers (corresponding to 10 different frequency bands) currently installed on ALMA, three were developed by NAOJ, and the SIS chips at the heart of these receivers were also developed and produced in the cleanroom of the NAOJ Advanced Technology Center (ATC). The NAOJ ATC continues to promote research on the miniaturization and integration of superconducting circuits, not only for realizing more powerful radio telescopes but also for their potential as the basis of various technologies that will support society in the new era, such as quantum supercomputing.

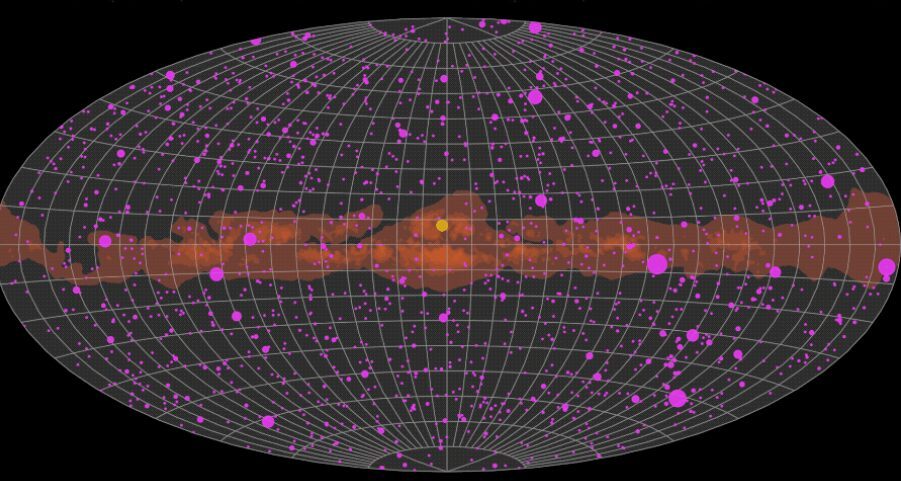
 aboard NASA’s Fermi Gamma-ray Space Telescope. Each object’s magenta circle grows as it brightens and shrinks as it dims. The yellow circle represents the Sun following its apparent annual path across the sky. The animation shows a subset of the LAT gamma-ray records now available for more than 1,500 objects in a new, continually updated repository. Over 90% of these sources are a type of galaxy called a blazar, powered by the activity of a supermassive black hole. Credits: NASA's Marshall Space Flight Center/Daniel Kocevski")
