A recent study conducted by the Institute for Basic Science (IBS) and its collaborating institutions presents compelling new evidence indicating that the planet's polar oceans are likely to experience a significant increase in turbulence as climate change progresses. High-performance supercomputing technology was essential to this research.
Simulation at Scale
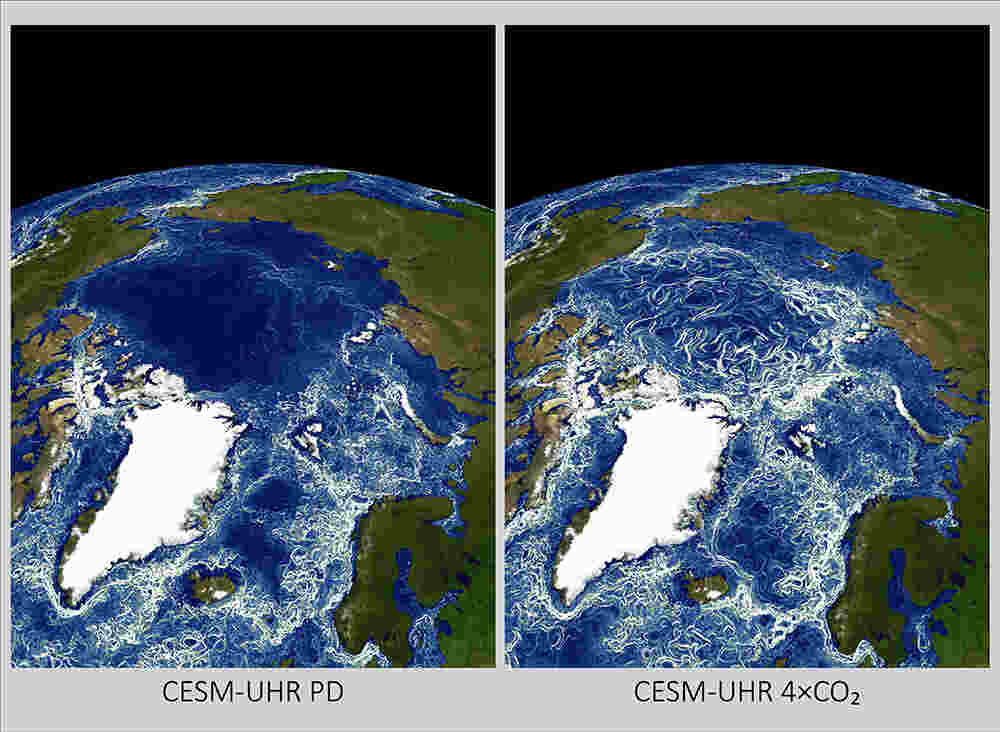
Researchers at the IBS Center for Climate Physics (ICCP) analyzed ocean currents, ice cover, and horizontal stirring—a process involving winds and currents that stretch and mix water masses, using ultra-high-resolution climate models. These models were executed on the supercomputer Aleph, which is situated at IBS in Daejeon, South Korea.
According to IBS, Aleph has a processing capacity of approximately 1.43 petaflops (1.4 quadrillion floating-point operations per second). It is important to note that running these finely-resolved simulations—which track ocean turbulence, sea ice decline, and the mixing of marine ecosystems—demands substantial computational resources, as well as considerable storage and data-handling capabilities. For instance, one ultra-high-resolution simulation generated approximately 5.3 terabytes of data per year of simulated time.
The research team conducted simulations using present-day CO₂ levels, doubled CO₂, and quadrupled CO₂ levels, incorporating atmospheric, oceanic, sea ice, and land feedback mechanisms within a fully coupled Earth system model. The simulations revealed a significant increase in "mesoscale horizontal stirring" (MHS) within both the Arctic and Southern Oceans under warming conditions, indicating heightened mixing, eddy activity, currents, and overall turbulence. Regional mechanisms vary; in the Arctic, sea ice loss facilitates more direct wind forcing and eddy generation, while in the Antarctic coastal region, increased freshwater input from melting ice enhances density gradients and strengthens currents such as the Antarctic Slope Current. The ecological consequences are considerable, as intensified mixing impacts nutrient distribution, plankton populations, larval transport of marine life, and even the dispersion of pollutants like microplastics.
Why supercomputing matters
This research underscores the crucial role of supercomputers in advancing climate science. Conventional climate models frequently employed coarse resolutions, with grid scales exceeding 100 kilometers, which limited their ability to accurately represent small-scale eddies and turbulence. In contrast, the simulations conducted by ICCP utilized resolutions of approximately 0.25° for atmospheric modeling and 0.1° for oceanic modeling, corresponding to a scale of roughly 10 kilometers for certain components. Without computational resources such as Aleph, achieving such high levels of resolution and scale would be infeasible. The demands on storage, memory, input/output, and computational throughput are substantial; one study utilized 11,960 cores, generating approximately 1.8 petabytes of output for a particular high-resolution configuration. In summary, supercomputing capabilities unlock critical insights, transitioning models from simplified approximations to detailed, physically accurate simulations of turbulence, eddies, ice-ocean interactions, and marine ecosystems.
From a practical perspective, these findings suggest that, in a warming climate, the polar oceans may exhibit behaviors currently underestimated by existing climate models. Increased turbulence will lead to heightened mixing of heat and nutrients, potentially influencing sea surface temperatures, ecosystem structures, and the dispersion of pollutants. From a broader scientific and infrastructural perspective, the study underscores the critical need for advanced computing resources in climate research. As models continue to advance in resolution, coupling, and complexity, such as through the integration of biological systems with physical dynamics, computational demands will continue to escalate. Institutions like IBS are currently preparing for the next generation of computing capabilities.
The planet is undergoing a period of increased activity, literally. Thanks to computing power once considered science fiction, scientists are now investigating the complex dynamics of our polar oceans and discovering that the next phase of climate change may manifest not only as gradual warming but also as accelerated turbulence, mixing, and widespread system rearrangements. The supercomputer Aleph has become one of the primary instruments in this evolving process.